Skills dashboard
 Hone
Est. 10 minutes
Hone
Est. 10 minutes
The problem
When Hone launched AI sessions, for the first time the product could assess how a learner actually performed a skill or behavior, not just whether they showed up to a class. Each session produces a skill score and a scenario checklist, giving a granular picture of what a learner did well and where they struggled. This data is generated entirely by Hone's AI, which meant the design work wasn't just about presenting information, but about making AI-generated assessments legible and trustworthy.
For a while, that data lived only on the learner side. After completing a session, learners could see their score, a breakdown of the scenario criteria they hit, and a summary of their skill demonstration. It was useful for individual reflection but organizational visibility was limited.
The obvious next question was what this data could tell admins. If a learner's manager or L&D team could see how their organization was performing across skills and sessions, they could make more informed decisions about where to focus development efforts, which sessions were driving results, and where skill gaps persisted. That was the premise for the Skills Dashboard.
The design challenge
Translating session performance data into an admin reporting surface involved some of the following challenges:
What does a skill score mean at the group level?
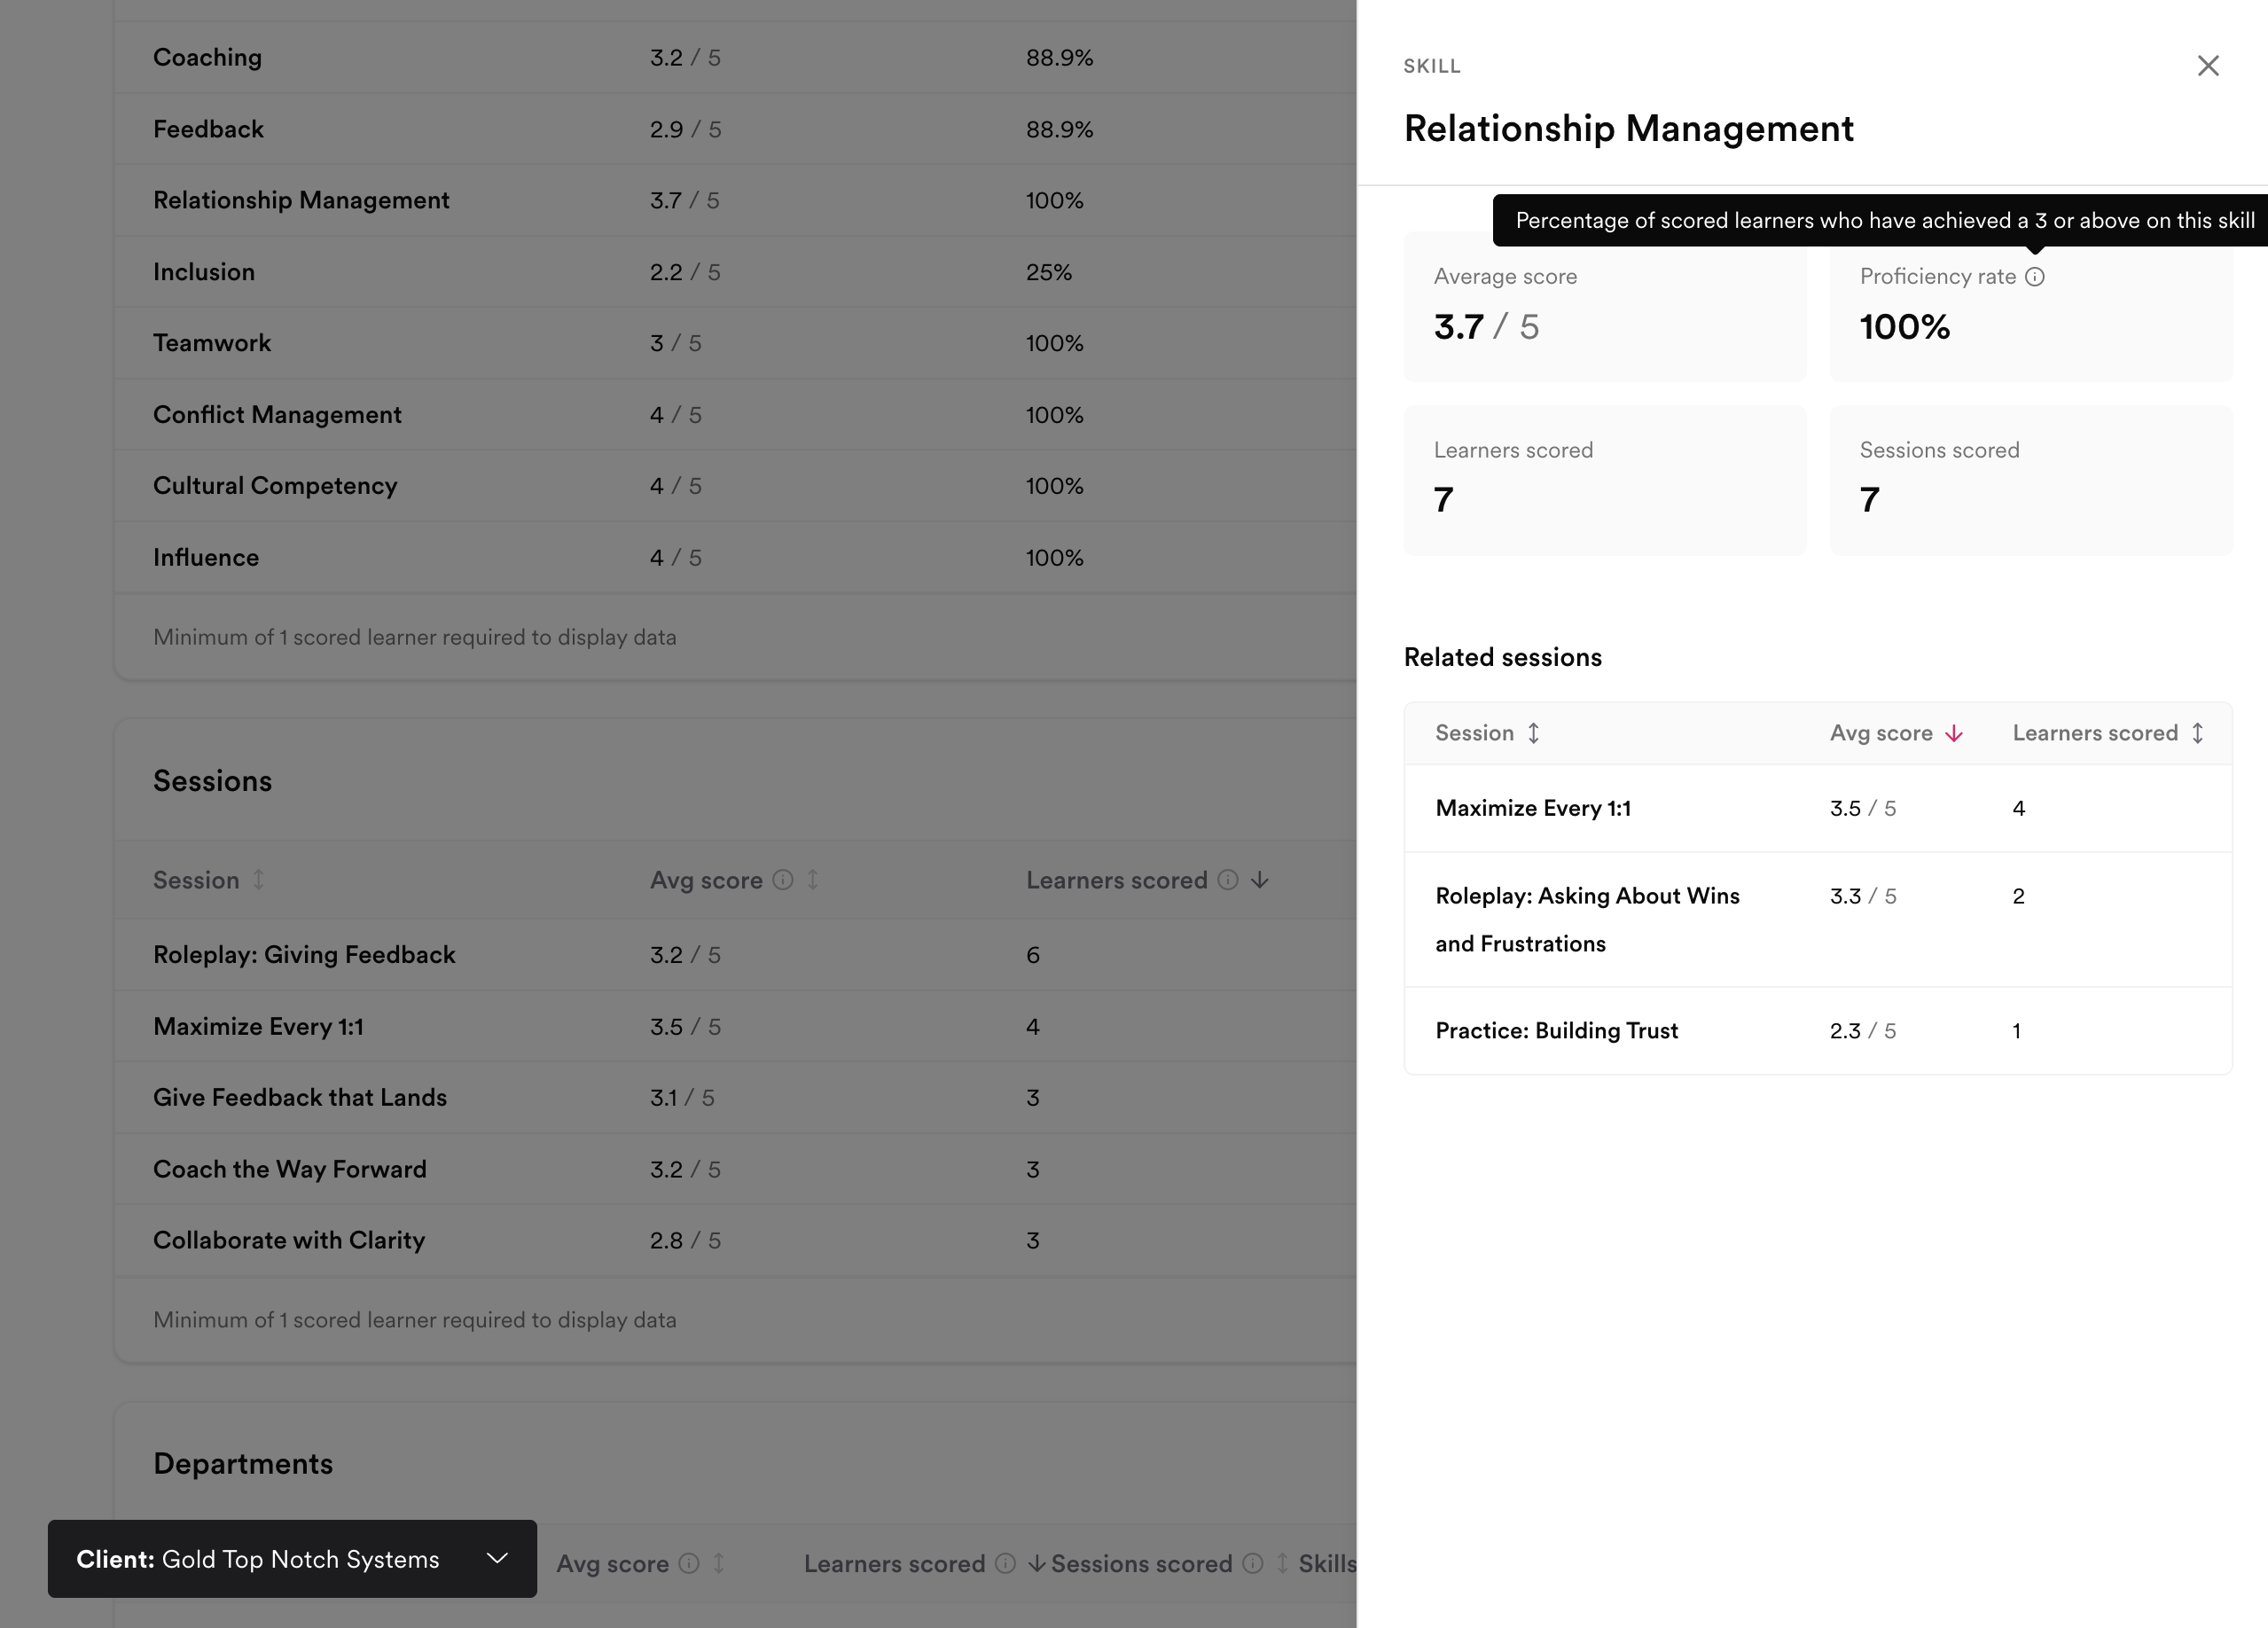
A single learner scoring 3 out of 5 on a skill is one data point. An average of 3 across a group doesn't necessarily mean the group is "proficient". It could mean half the group is at 4 and half is at 2, which tells a very different story. Early explorations used proficiency labels on group averages and our Learning Experience team quickly flagged this as conceptually wrong. I needed to represent population-level data accurately without implying a precision the underlying data doesn't support.
What can admins actually do with this?
While aggregate data is interesting, data that's actionable is more useful. The gap between the two has been a persistent challenge throughout this project. Showing an admin that their organization scores 3.2 out of 5 on "Giving Feedback" is a starting point but it raises more questions than it answers. Which learners? Which sessions? What does 3.2 even mean in context? Is that good or bad? The V1 scope addressed the aggregate view but continued customer testing and conversations made it clear that individual-level data was where admins actually wanted to go, which was surprising and actually contradicted the way our admins had been leveraging Hone's data so far.
The learner behavior question
Making individual scores visible to admins introduced a risk. If learners know their scores are being reviewed, some may avoid sessions where they expect to perform poorly which would, of course, undermine the purpose of Hone's product. This concern hasn't been confirmed by evidence yet so it certainly hasn't stopped us from leaning in to our admins' desire for learner-level data. However, we've explored giving learners visibility into which sessions generate admin-visible scores, allowing learners to submit or flag scores for review, and discouraging the use of results in performance evaluation contexts as potential ways to mitigate this risk.
The process
Grounding in customer need
The original driver came from direct customer input that admins wanted to understand where their learners' skill gaps were and use that to make development decisions. I shared an early prototype with customer-facing team members for feedback before moving into visual design with a specific prompt to view it as an admin seeing the dashboard for the first time. That round of feedback tightened the design considerably. I refocused the insights section on wins and actionable information, descoped a pet favorite feature (😢), and added a mastery level legend to help admins orient to what the scores meant.
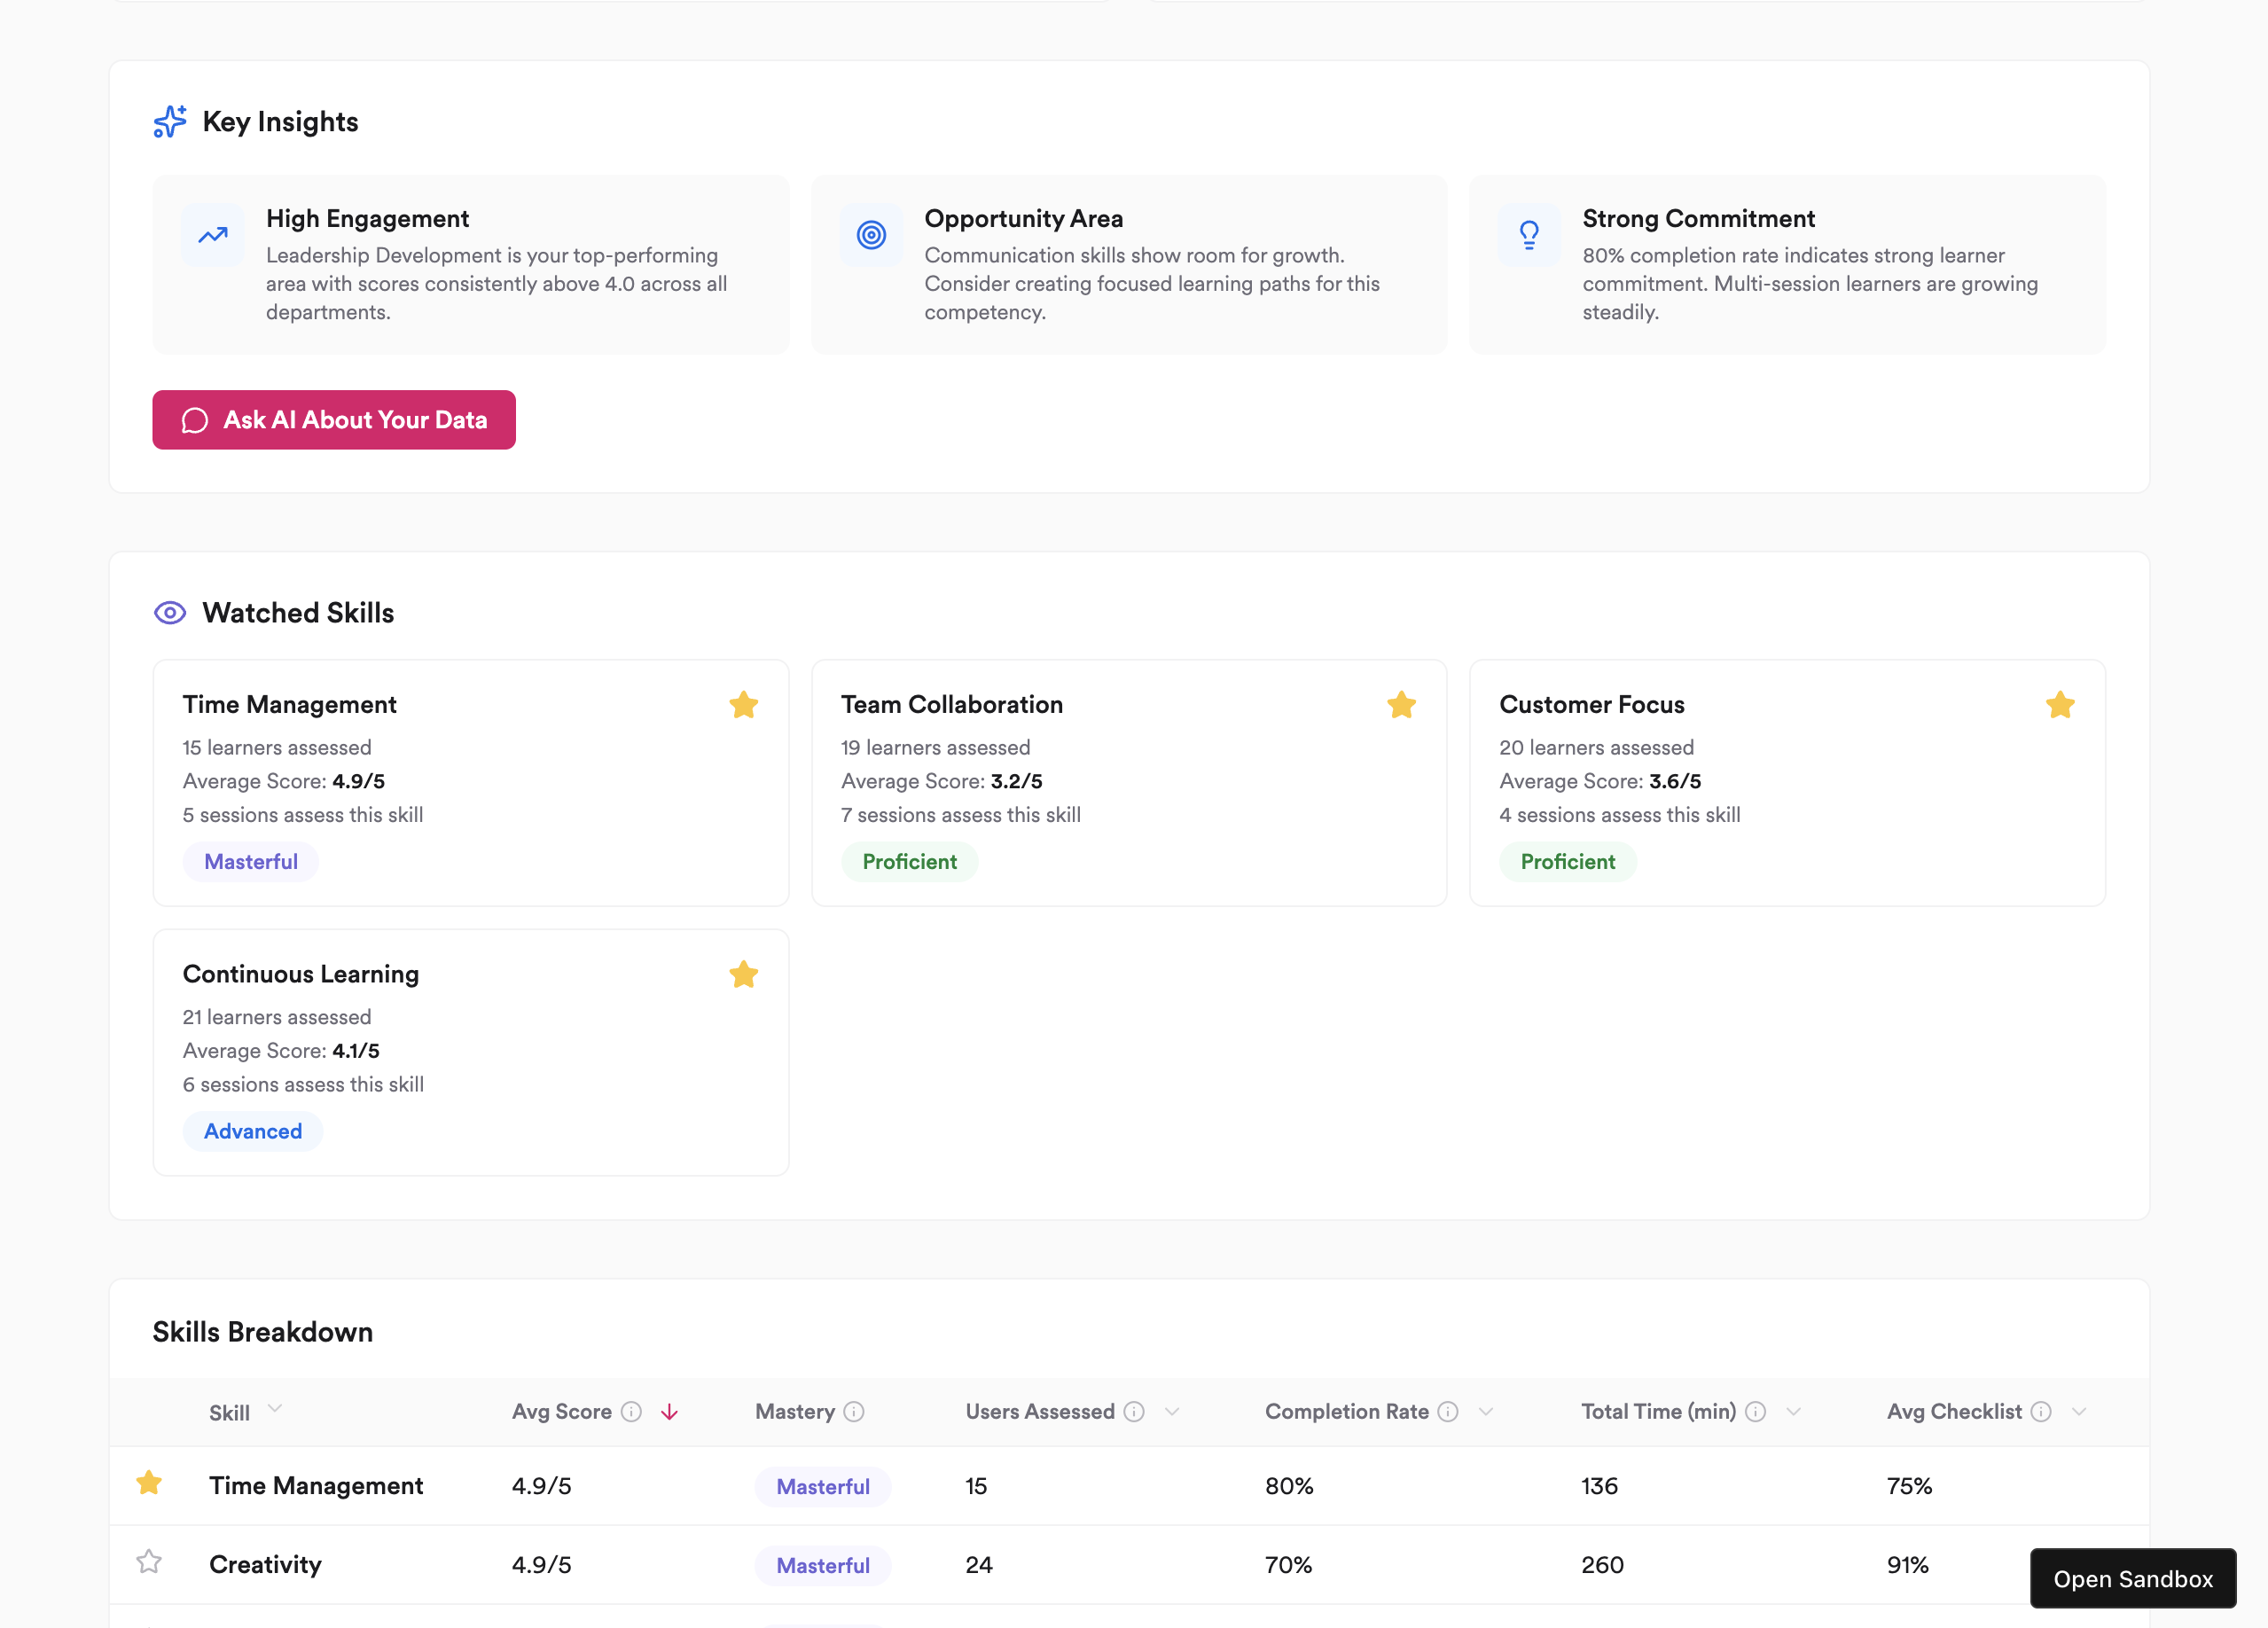
The shipped V1 dashboard includes an org-wide skills breakdown with average scores, proficiency distribution, and learner and session counts per skill. A sessions table shows performance by session type. A departments table lets admins slice the same data by team. Filters allow admins to narrow by department, location, and skill.
The "Key Insights" section surfaces three automatically generated observations: a top-performing area, an opportunity area, and an engagement signal. An "Ask AI About Your Data" prompt gives admins a direct way to query the data in plain language, a feature that came out of early internal feedback and was consistently praised as one of the most useful elements of the design. Rather than building a fixed set of charts to anticipate every admin question, a conversational interface lets admins ask what they actually want to know which, at this stage of the product, neither we nor our admins could fully predict. We phased our table data to release first and this section to be released following a related update to the admin platform IA.
What customer conversations surfaced
As V1 neared release, we demoed the dashboard to a small group of customers. The reaction confirmed that aggregate data was a useful starting point but individual-level data was where admins' attention went almost immediately, even for our enterprise customers. As one customer put it, they wanted a tool that could tell them where skill gaps are, how to fill them, and whether filling them had worked.
Enabling independent implementation
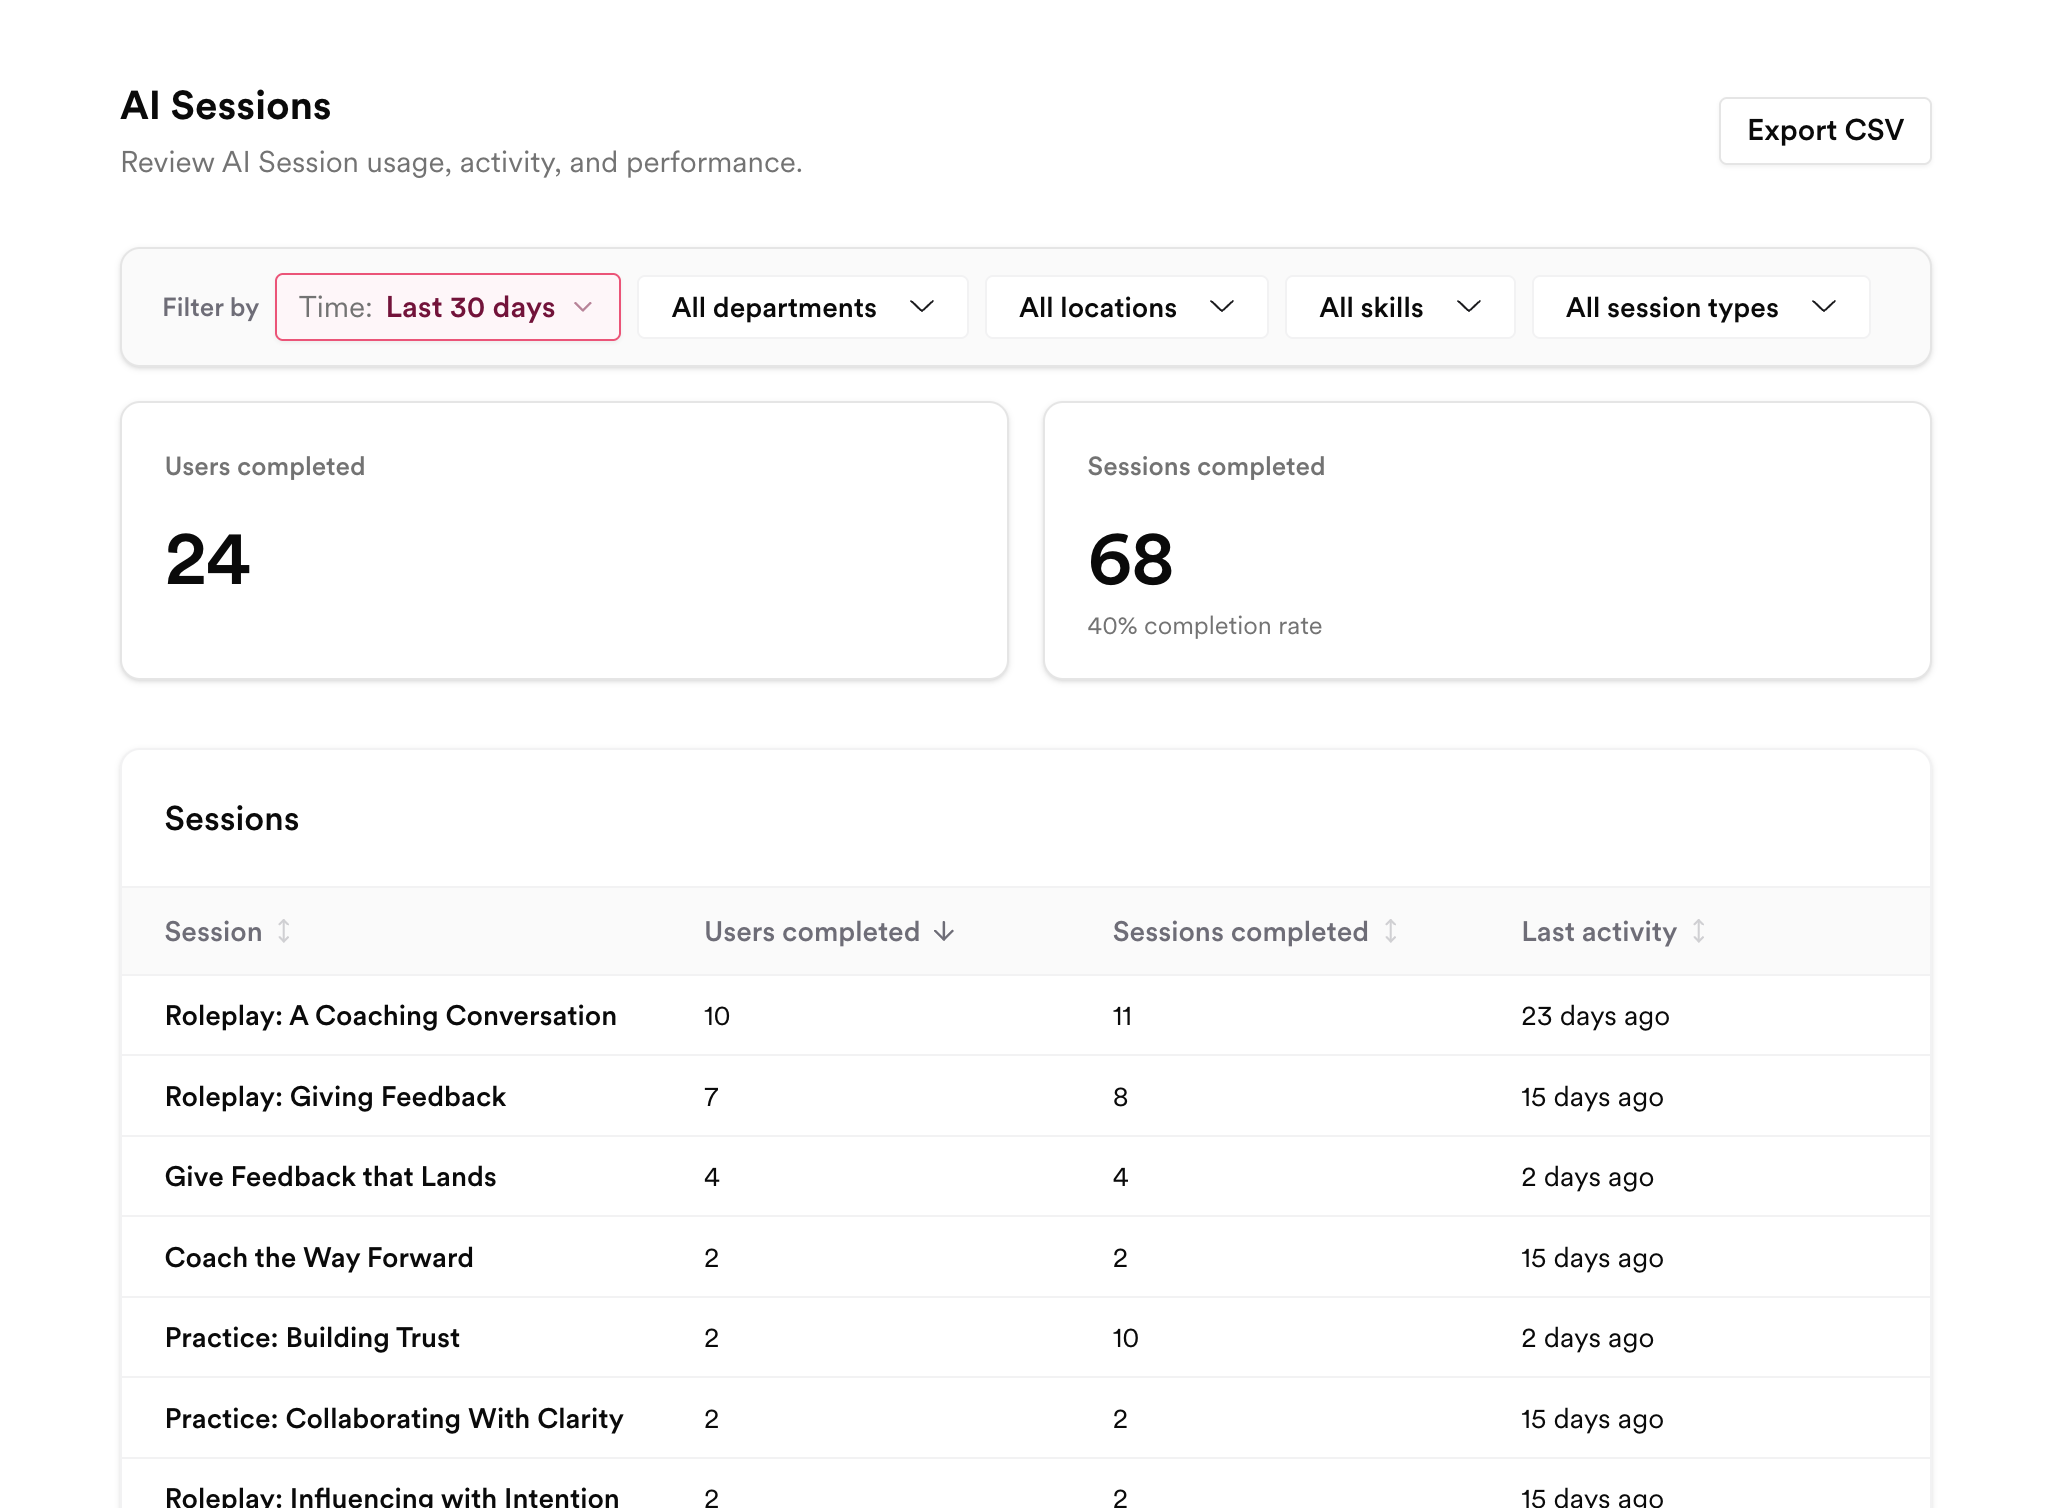
As a result of this customer feedback, we started on an AI Sessions reporting page that would give admins that more granular view of session activity, completion rates, and usage over time for individual learners that they had been asking for. Rather than producing detailed Figma mocks for this page from scratch, we were able to leverage a component library implemented at the end of 2025 as well as reporting patterns established on the Skills Dashboard to enable a developer to get started on implementation as soon as we had aligned on our MVP IA.
The result is a consistent experience that follows the same conventions as the Skills Dashboard (same filter structure, table patterns, and data hierarchy) without the bottleneck of a separate design phase. We were able to react nimbly to customer feedback by establishing the standards and components that let engineering move confidently without waiting for detailed specs on every new surface.
V2 direction
V2 is focused on making the dashboard actionable at the individual level. The planned additions include per-learner drill-down within the admin view, delta and improvement tracking over time, scenario checklist items and granular pass/fail data, and skills assessed holistically across all AI interactions rather than from a single session.
The individual visibility work will also require working through the learner behavior question in earnest and establishing the right guardrails to make admin access to individual data feel safe and trustworthy for learners.
Ask me about:
- How the proficiency labeling problem shaped the way we represent population-level data
- The component library work that enabled the AI Sessions page to be built without detailed design specs
- How we're thinking about the tension between admin visibility and learner trust as individual-level data comes into scope